
Analytics tells you whether your B2B pricing is making you money. It counts only orders the app priced. Retail sales never appear here, so every figure on the page is B2B — for store-wide numbers, use Shopify Analytics.
Navigate to Smind B2B > click on View full Analytics
The date picker at the top controls every number below it: Today, Yesterday, Last 7 days, Last 30 days, Last 90 days, Last 365 days, This year, Last month or Custom. The page default on the last 30 days, and every % change compares your period against the same length of time immediately before it.
Check store’s B2B revenue
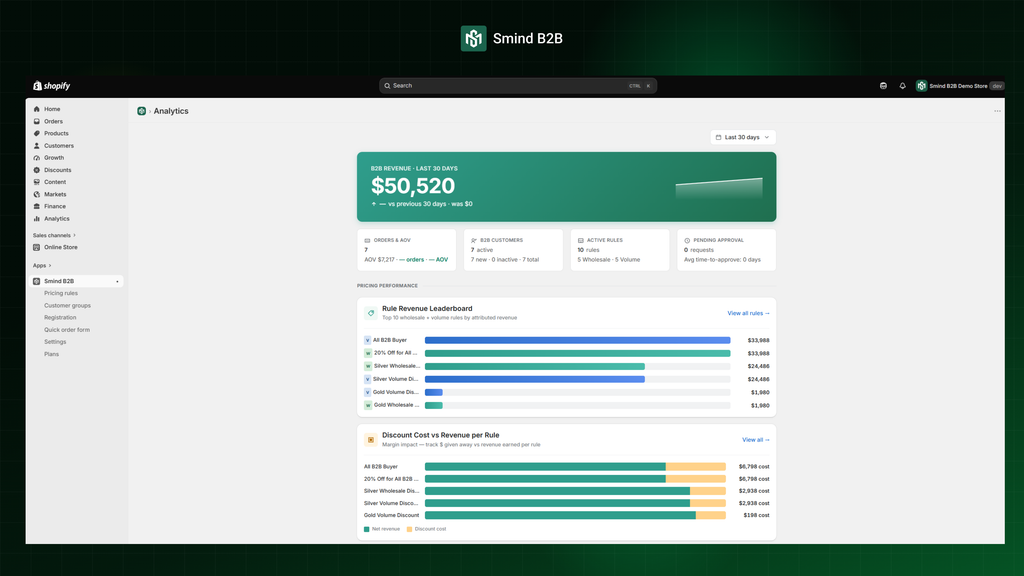
B2B revenue is the headline: revenue from orders the app priced, with its change against the previous period and a day-by-day trend line.
- Orders & AOV: How many orders, and average order value — each with its own change
- B2B Customers: include Active, New, Inactive and Total. Active means they ordered inside your chosen period and Inactive means they are in a group but did not. A big Inactive number next to a small Active one means you have approved buyers who are not buying
- Active Rules Live rules now, split wholesale / volume, plus how many expire soon
- Pending Approval Applications waiting on you, and your average days to approve. To watch the average days rather than the count, because applicants who wait tend to go elsewhere.
Check pricing performance
Pricing performance include 3 panels: “Rule Revenue Leaderboard”, “Discount Cost vs Revenue per Rule” and “Volume Tier Adoption”
Rule Revenue Leaderboard: Top 10 wholesale + volume rules by attributed revenue
Your top 10 wholesale and volume rules by revenue. Credit is given line by line: a rule earns the value of the cart lines it actually priced, not the whole order. A rule at the bottom is doing nothing, usually its scope is too narrow, it is attached to a group nobody is in, or its buyers are not interested in those products.
Note: A deleted rule still appears as (deleted rule) if it priced orders during the period. The revenue happened, so removing the rule does not erase it.
Discount Cost vs Revenue per Rule: Margin impact, track $ given away vs revenue earned per rule
The five rules that cost you most in discounts, showing what share of each rule’s gross went to the buyer against what you kept. A rule near the top of both is buying its revenue, and the question is whether you can afford the price.
Volume Tier Adoption: % B2B orders per quantity tier · “All B2B Buyer” rule
Where buyers actually landed on your highest-earning volume rule. Each bar is one tier, labelled like `10-49 · 10% off` — with the share of orders and the share of revenue it captured.
- Everything in the bottom tier: your next tier starts too far away to reach
- Everything in the top tier: you are discounting deeply for buyers who would have bought that much anyway
- Spread across tiers: the ladder is working
Only your biggest volume rule appears here.
Read customer insights
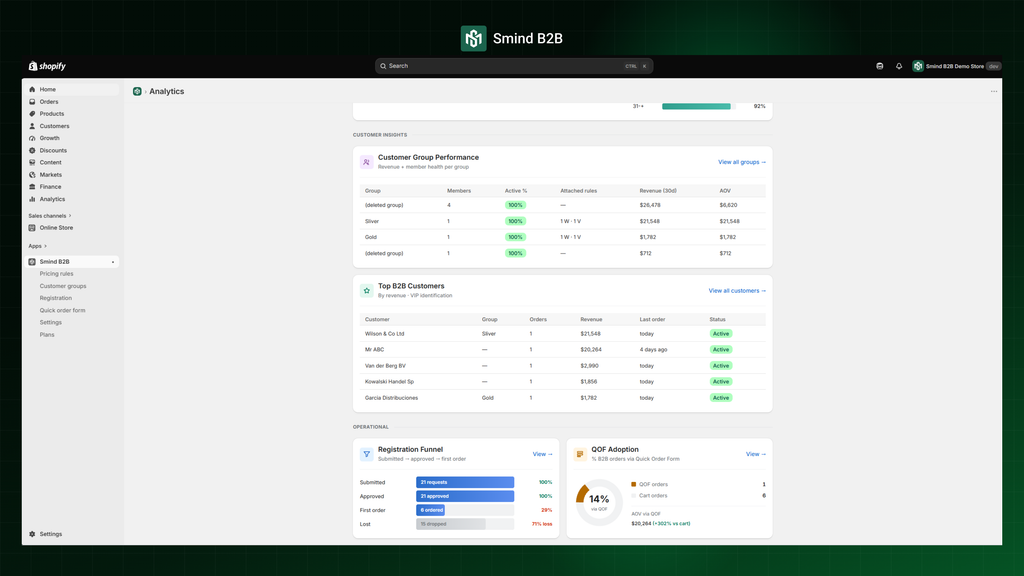
On screen this section is Customer insights, including “Customer Group Performance” and “Top B2B Customers”
Customer Group Performance: Revenue + member health per group
One row per group.
- Members: People in the group
- Active %: Share of them who ordered in your chosen period. Many members and a low percentage means the pricing is not landing, and zero attached rules means the group gets no B2B pricing at all.
- Attached rules: How many pricing rules the group uses
- Revenue & AOV: What the group brought in. Revenue goes to the group whose rule won the price, so a buyer in several groups counts toward the one that actually set what they paid.
Top B2B Customers: By revenue · VIP identification
Your five highest-revenue buyers, with orders, revenue, last order date and a status. The Group shown is the one that has earned the most from that customer over their lifetime, which helps when someone matches several groups.
A high-revenue customer marked Inactive is the most actionable thing on this page. It is a good buyer going quiet, and it is worth a phone call.
Check operational health
On screen this section is headed Operational, include Registration Funnel and QOF Adoption
Registration Funnel
Applications submitted during your period, followed through three steps: submitted → approved → first order.
Each gap means something different. Losing people between submitted and approved is your queue or your rejection rate. Losing them between approved and first order is more expensive — you accepted a buyer who never bought, usually because nobody told them their prices were ready.
QOF Adoption
Orders placed through the Quick Order Form against orders placed through the normal cart, with the average order value of each. The AOV comparison is the point. The form exists so buyers can order many lines at once, so if its AOV is not higher than the cart’s, buyers either are not finding it or are not seeing the right products in it.
Frequently Asked Questions
What to do when a panel is empty?
Panels say so in words rather than showing zeros — for example *No rule-attributed revenue in this period yet.*
Widen the date range first. If the message stays on a store that is definitely selling, then no order in that period was priced by the app. Check that your rules are Active, that each is attached to a customer group, and that the **Smind B2B** app embed is turned on in your published theme.
What Analytics does not cover?
Retail sales, inventory, traffic and conversion rate all live in Shopify Analytics. This page also cannot show you shoppers who never checked out, so it will not tell you who looked at your wholesale prices and walked away.